What is the Dukaan Analytics dashboard?
The Dukaan analytics dashboard gives you a detailed analysis of your store's sales, traffic and product data.
In this article, we will go over how we can analyse the sales of your store using the Analytics dashboard.
If you would like to learn about the traffic analytics section, click here.
If you would like to learn about the product analytics section, click here.
How to analyze your store's sales?
To analyze the sales of your store, click on Analytics on your store's dashboard.
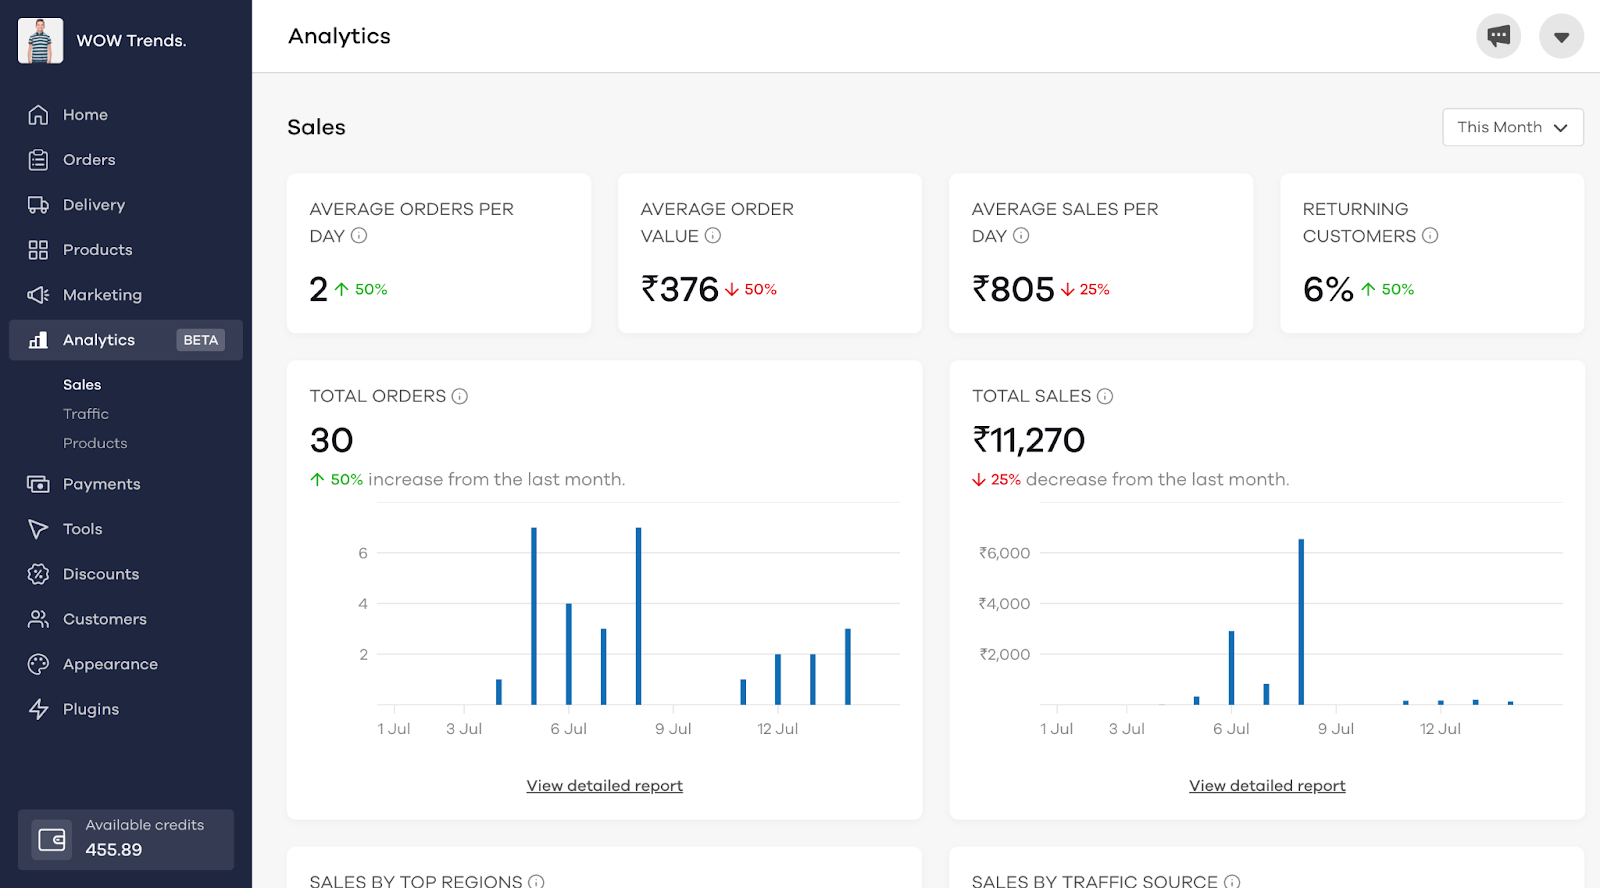
Upon clicking on Analytics, The sales dashboard will be presented by default. Here, you can view various analytics like:
- Average orders per Day
This tab shows the average number of orders per day in the selected period of time.
- Average order value
Here you can view the average value of all the delivered orders in the selected period of time.
- Average sales per day
The Average sales generated from all the delivered orders per day in the selected time.
- Returning Customers
This tab shows the percentage of users who have placed more than 1 order in the selected period of time.
- Total Orders
The total number of orders a store has received over the selected period of time.
- Total Sales
The total sales a store has done in the specified time period.
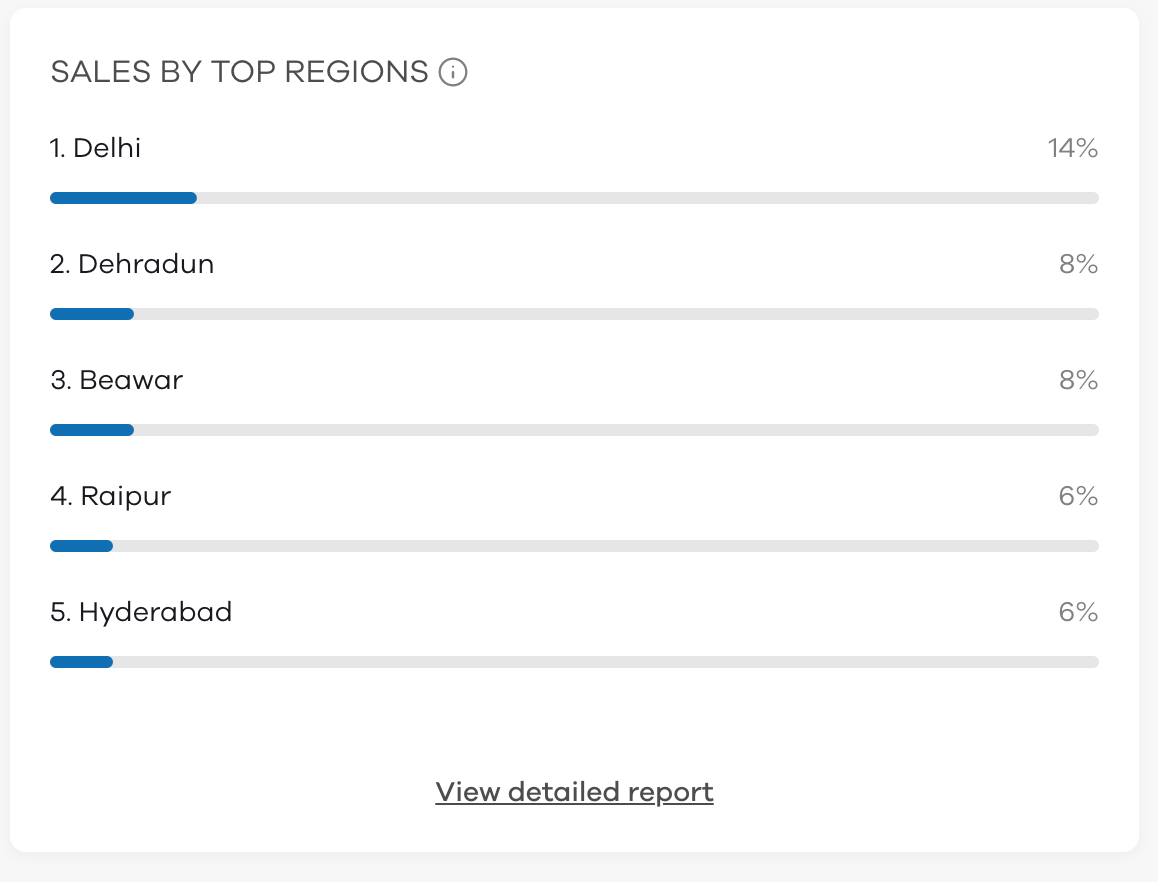
- Sales by top regions
This category shows us the top performing regions in terms of Sales. As you can see in the image below Delhi has 14% of the total sales making it the highest performing region
- Sales by Traffic Source
This category shows us the top-performing source of traffic. I.e. The source from where your customers found out about your store.
The Dukaan Analytics tab provides you with further insight by giving us a percentage increase or decrease in the following categories:
- Average orders per Day
- Average order value
- Average sales per day
- Returning Customers
- Total Orders
- Total Sales
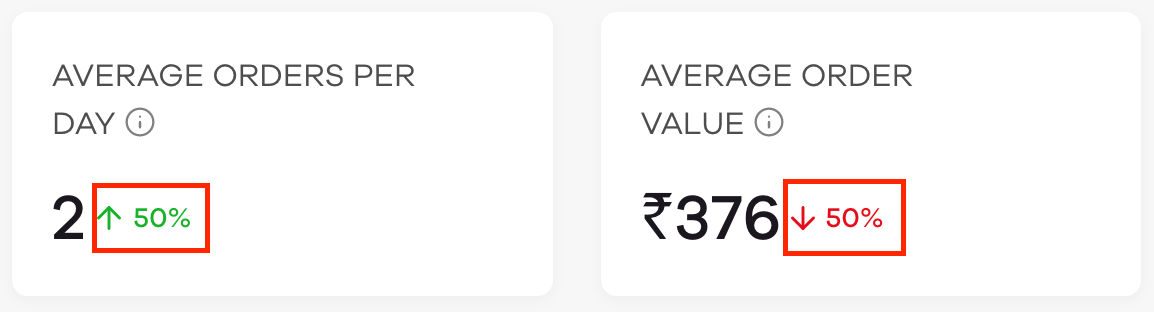
In Average Orders Per Day, we can see that there is a 50% increase in the orders per day. The percentage increase will be shown in green with an arrow pointing up right beside it.
In Average Order Value, we can see that there is a 50% decrease in the average order value. The percentage decrease will be shown in red with an arrow pointing down right beside it.
How to view detailed reports of your store analytics?
The analytics dashboard allows us to view detailed reports in various categories. To view a detailed report in the following categories:
- Total Orders
- Total Sales
- Sales by top regions
- Sales by Traffic Source;
Click on View detailed report.
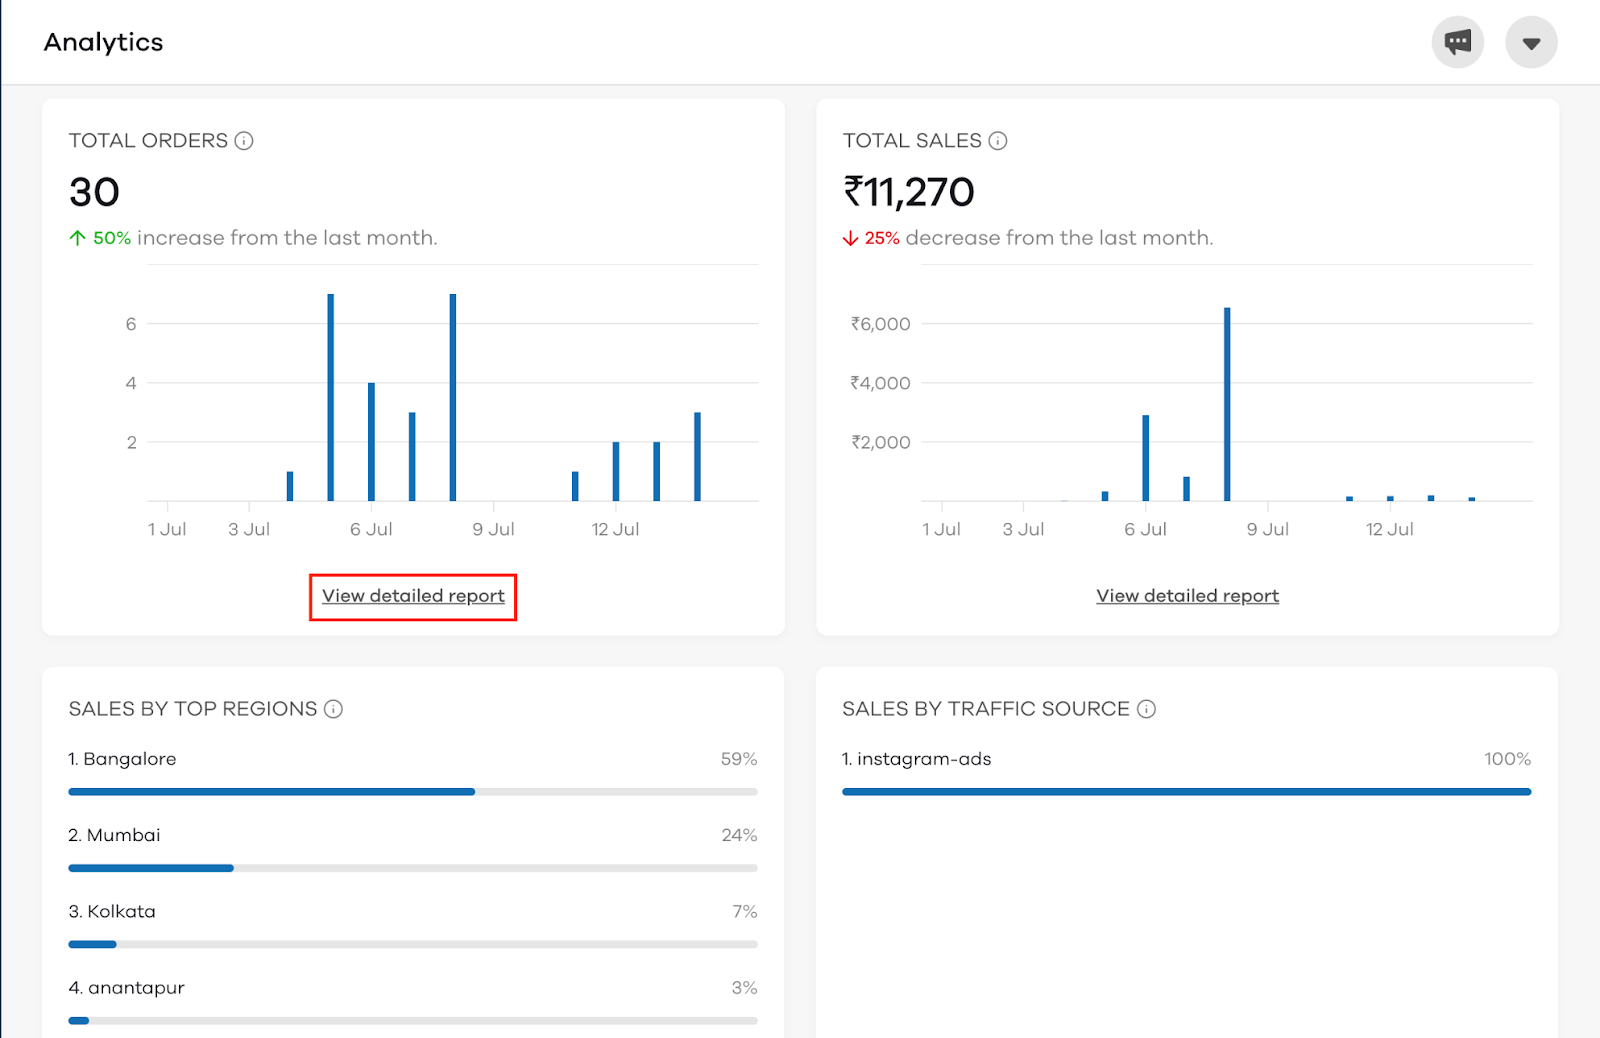
On clicking View detailed report. The following screen appears:
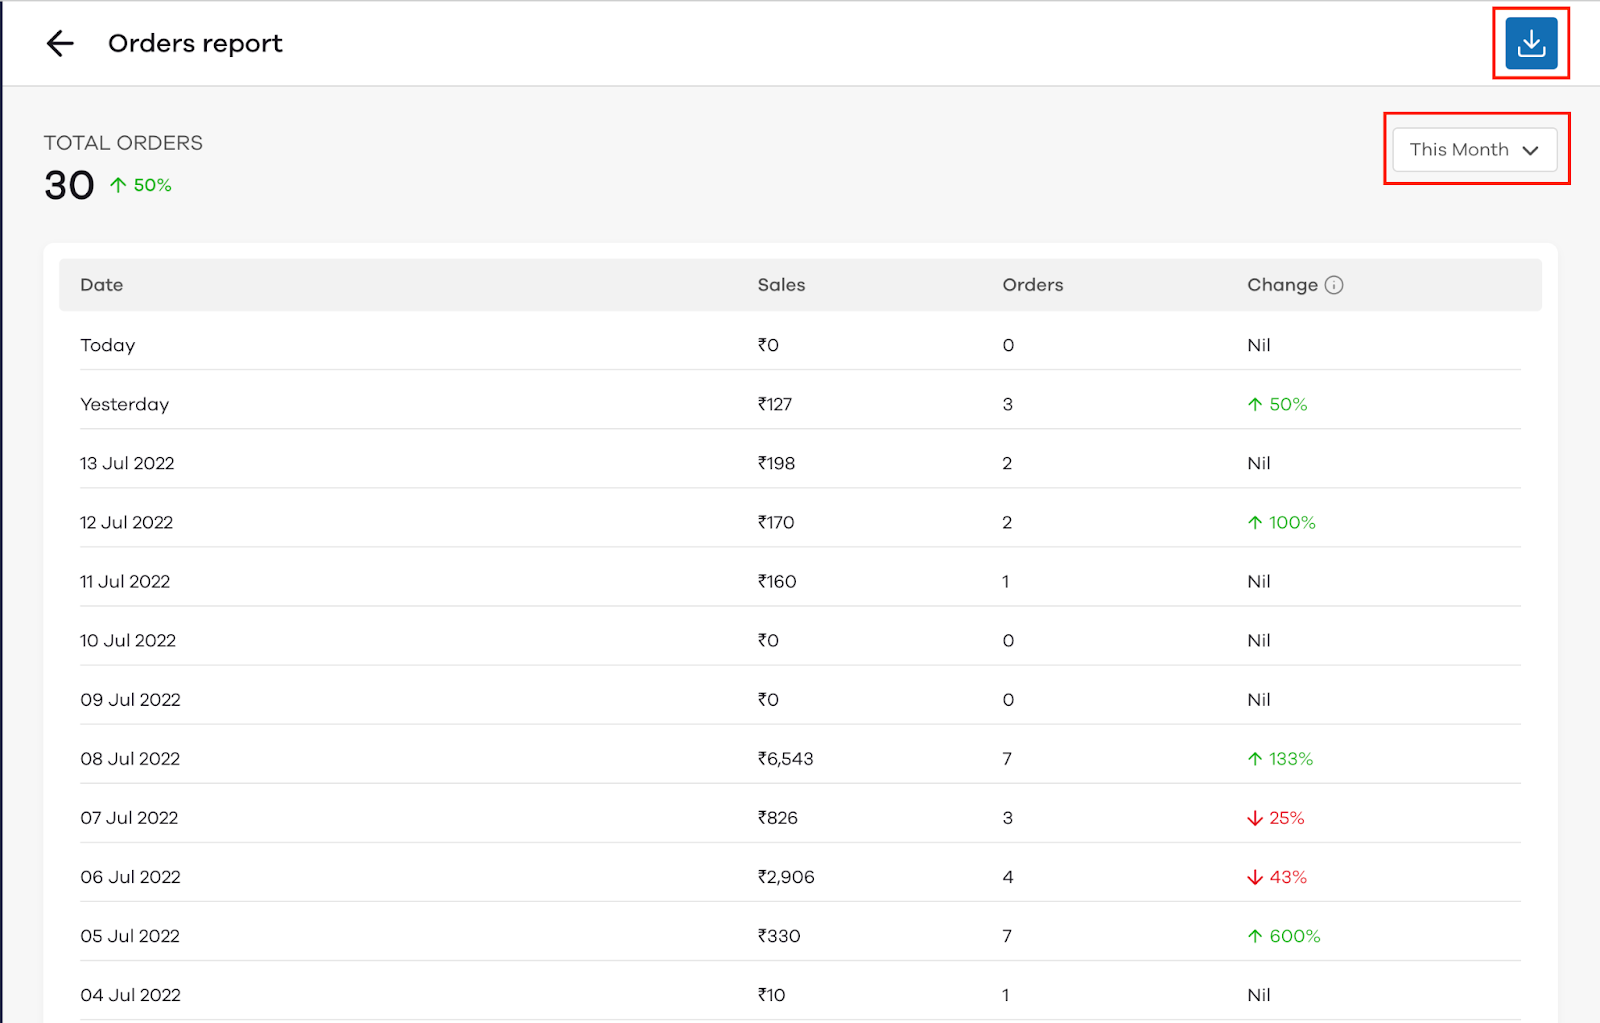
On clicking View detailed report, you can see your store sales. Here you can also filter the report and view it in Months, custom range, yesterday, etc, by clicking on This month.
How to download the report?
To download the report, click on the blue download button in the top right corner of the screen.
Read More: